From outliers to promotions: S&OP software demos raise questions

Where do you start when looking for software support for Sales & Operations Planning (S&OP)? What capabilities do modern systems offer? And how do you select a system that fits the maturity level of your S&OP process? The IT Demo Day held on 6 June gave supply chain professionals from home and abroad a first impression. A salvo of questions was fired off as soon as the demos began.
By Marcel te Lindert
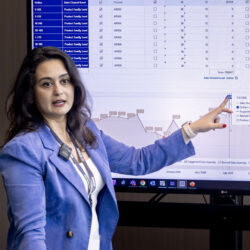
Martijn Lofvers (pictured) likes to compare selecting supply chain software to buying a car. Do you opt for the proven technology of established brands, or go for that innovative newcomer in the market? Do you fall for the beautiful lines and speed of a sports car, or do you prefer a combination of solidity and affordability? ‘One piece of advice: look under the bonnet and take a test drive,’ says the Supply Chain Media founder at the start of the IT Demo Day. ‘The same goes for the selection of S&OP software. Don’t rely purely on PowerPoints. Only during a demo do you really get a good impression of the possibilities.’
The people watching the demos of the four S&OP retail and wholesale software vendors do indeed get an idea of their solutions. Remira’s solution can be compared to a decent German mid-sized car and does precisely what it should do. Flowlity’s has the elegance and driving comfort of a French sedan. Like Tesla’s self-driving cars, Logility has packed its innovative solution with artificial intelligence. And implementation partner Keyrus resembles a leasing company that first identifies the need and then looks for the most suitable solution, whether from Anaplan or Pigment.
Price elasticity
Once each vendor turns off their PowerPoint and logs in to the demo environment of their S&OP software, the audience starts asking questions. How do you forecast a new item that has no sales history yet? How do you see what part of the forecast is the result of promotions? How can the software help to understand the price elasticity of an item? And how do you find out which events are responsible for sales peaks? Remira, Flowlity, Logility and Keyrus specialists patiently click through the software to answer all questions.
Remira shows how you can create a forecast without a sales history by linking the new item to an already existing similar item. Flowlity explains why the outcome of their forecast is not an exact number but a value that includes uncertainty. Logility demonstrates how generative artificial intelligence (GenAI) is used to help their software answer complicated questions from planners in understandable language. Keyrus shows why an end-to-end solution is needed to identify the cause when market demand cannot be met.
Look three steps ahead
Menno Klomp of Samsung Climate Solutions came to the IT Demo Day with two people. The S&OP process is only just starting at the climate technology supplier. ‘Are we in the orientation phase? We are in the pre-orientation phase,’ the supply planning team leader concedes. ‘We make a weekly forecast with quite a long horizon because of the long delivery times from the Far East. In practice, that means we ask the 16 sales offices in Europe to fill in what they expect to sell, no more and no less. To do that, we have to go through all the products manually.’
The need for a smarter, scalable forecasting solution is growing within Klomp’s team, mainly because of the increasingly stringent requirements for the use of refrigerants in air-conditioning systems. To prevent Samsung from being stuck with dead stock later on, it is important to phase out devices with prohibited refrigerants at the right time. But how do you determine when that is? ‘The standard message is that before you start selecting and implementing S&OP software, you need to get the basics right. But in our case, I think it is good to look three steps ahead and find out the options.’
Explaining outliers
The IT Demo Day is impressive. Klomp and his colleagues are particularly impressed by the possibilities offered by Logility and Flowlity, including in relation to outliers – deviations in sales history that cannot be explained statistically. ‘It would be nice if we could discuss where those outliers come from with our sales offices. Maybe they got a big project, or lost a customer. If we can indicate that in a forecasting tool, the forecast will be automatically corrected.’
Klomp hopes that a smarter S&OP tool will also eventually lead to higher stock availability. Klomp: ‘We have eight warehouses in Europe, from where we supply air conditioners to the consumer market. Demand for them depends heavily on the weather. The current way of forecasting regularly leads to the wrong products being in the wrong warehouses. We can still improve a lot in that area.’


